2025 Vulnerability Statistics Report
Celebrating a Decade of Security Insights
Welcome to the 10th anniversary edition of the Edgescan Vulnerability Statistics Report! Drawing from our analysis of thousands of security assessments and penetration tests conducted globally throughout 2024, this landmark report delivers authoritative insights into the cybersecurity landscape across hundreds of organizations and industries worldwide.
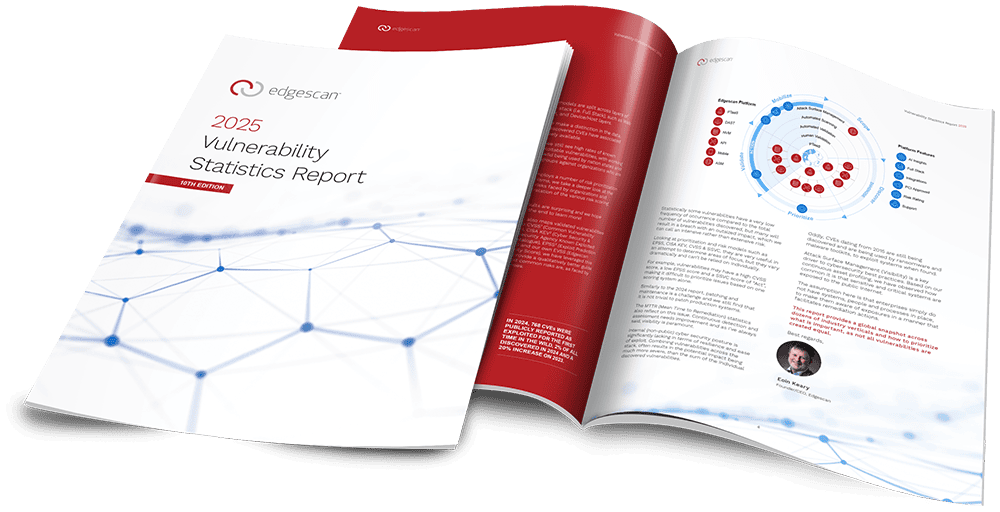
Our 2025 report delves deeper than ever before into critical metrics that matter to security professionals. We explore Risk Density patterns across network/device and application layers, uncover complex vulnerabilities that automated tools consistently miss, and evaluate the real-world effectiveness of today’s leading vulnerability scoring methodologies including EPSS, CISA KEV, CVSS, and our proprietary EVSS system.
This year’s findings reveal significant industry variances in vulnerability remediation efficiency, with software companies achieving the fastest mean time to remediate (63 days) while construction sector organizations lag considerably (104 days). We’ve also identified concerning patterns in vulnerability management, with larger enterprises leaving 45.4% of discovered vulnerabilities unresolved within a 12-month period—predominantly within the network/device layer.
- Across the full stack, more than 33% of discovered vulnerabilities were of critical or high severity
- SQL Injection (CWE-89) remains the most common critical web application vulnerability, continuing a trend since 2022
- The mean time to remediate (MTTR) a critical severity web application vulnerability is 35 days, while internet-facing host/cloud vulnerabilities take 61 days on average
- In 2024, a record-breaking 40,009 Common Vulnerabilities and Exposures (CVEs) were published
- The CISA Known Exploited Vulnerabilities (KEV) catalog contained 1,238 vulnerabilities by the end of 2024, with 185 added during the year
- 768 CVEs were publicly reported as exploited for the first time in the wild in 2024, representing 2% of all discovered vulnerabilities and a 20% increase from 2023
For a decade, our Vulnerability Statistics Report has served as the definitive resource for security professionals seeking to understand emerging threats and optimize their defensive strategies. Download the complete 2025 report today and gain the actionable intelligence you need to strengthen your organization’s security posture.

Some rare vulnerabilities cause outsized damage when exploited—”intensive rather than extensive risk.” No single risk scoring system is sufficient. EPSS, CISA KEV, CVSS, and SSVC offer valuable but sometimes contradictory guidance.
Production patching remains difficult, reflected in our MTTR statistics. Continuous assessment visibility is essential. Internal networks show alarming security gaps, with vulnerabilities compounding across the technology stack.
CVEs from 2015 are still being discovered and exploited by modern malware. Attack Surface Management is critical—too many sensitive systems remain exposed due to poor visibility.
This report helps prioritize what matters across industries, because not all vulnerabilities are equal threats.
— Eoin Keary, CEO & Founder
Overview of the Edgescan Vulnerability Stats Report
Since 2015 Edgescan has annually produced the Vulnerability Statistics Report to provide a global snapshot of the overall state of cybersecurity. The report presents a by-the-numbers insight into trends and statistics looking back across a 12-month data set from the previous year, including cyber threats, data breaches, and cyber attacks. Every year the report provides a statistical model, that is presented using infographics and charts, of the most common weaknesses faced by enterprises to enable data-driven decisions for managing risks and exposures more effectively.
This yearly report has become a reliable source for approximating the global state of vulnerability management. This is exemplified by our unique dataset being part of the Verizon Data Breach Report (DBIR), which is the de facto standard for insights into the common drivers for incidents and breaches today.
Methodology of Data Collection
The vulnerability data analyzed for the Edgescan Vulnerability Statistics Report was collected from thousands of security assessments and penetration tests performed on millions of assets; this growing collection of intelligence is stored in our data lake and shared amongst the solutions that comprise the Edgescan Platform.
Vulnerability data was sourced from over 250 companies of various sizes, Fortune 500 to medium and small businesses, across 30 industry verticals.
Contact us for more information on how Edgescan can help secure your business.

